Monitoring Your Jobs on AI-LAB
This guide will help you monitor your jobs, check system resources, and troubleshoot issues on AI-LAB.
Checking the Job Queue
The job queue shows all jobs currently running or waiting for resources.
View All Jobs
Example output:
JOBID   PARTITION       NAME      USER    ST      TIME    NODES   NODELIST(REASON)
42      gpu             interact  user1   R       6:45:14 1       ailab-l4-01
43      gpu             training  user2   PD      0:00:00 1       (Priority)
View Only Your Jobs
Understanding the Output
| Column | Description | Example |
|---|---|---|
JOBID |
Unique job identifier | 42 |
PARTITION |
Queue partition | gpu |
NAME |
Job name (set by user) | training |
USER |
Username | user1 |
ST |
Job state | R (running), PD (pending) |
TIME |
How long job has been running | 6:45:14 |
NODES |
Number of nodes allocated | 1 |
NODELIST |
Which node or reason for waiting | ailab-l4-01 or (Priority) |
Common Job States
R(Running): Job is currently executingPD(Pending): Job is waiting for resourcesCG(Completing): Job is finishing upCD(Completed): Job finished successfullyF(Failed): Job failed with an error
Checking Compute Node Status
Monitor compute nodes to see available resources and system health.
Basic Node Information
Example output:
PARTITION       AVAIL      TIMELIMIT      NODES      STATE             NODELIST
l4*                up       12:00:00         11       idle     ailab-l4-[01-11]
vmware             up          10:00          4       idle        vmware[01-04]
Understanding the Output
| Column | Description | Example |
|---|---|---|
PARTITION |
Queue/partition name | l4*, vmware |
AVAIL |
Partition availability | up (available) |
TIMELIMIT |
Maximum job time | 12:00:00 (12 hours max, 1 hour default) |
NODES |
Number of nodes | 11 |
STATE |
Node status | idle, mix, allocated |
NODELIST |
Specific nodes | ailab-l4-[01-11] |
Node States
idle: Node is completely free and availablemix: Node is partially used (some resources available)allocated: Node is fully occupieddown: Node is offline or having issues
Detailed Node Information
Get detailed information about a specific node:
This shows: - CPU allocation and total cores - Memory usage - GPU information - Node features and capabilities
User-Friendly Node Summary
For a more intuitive view of system resources:
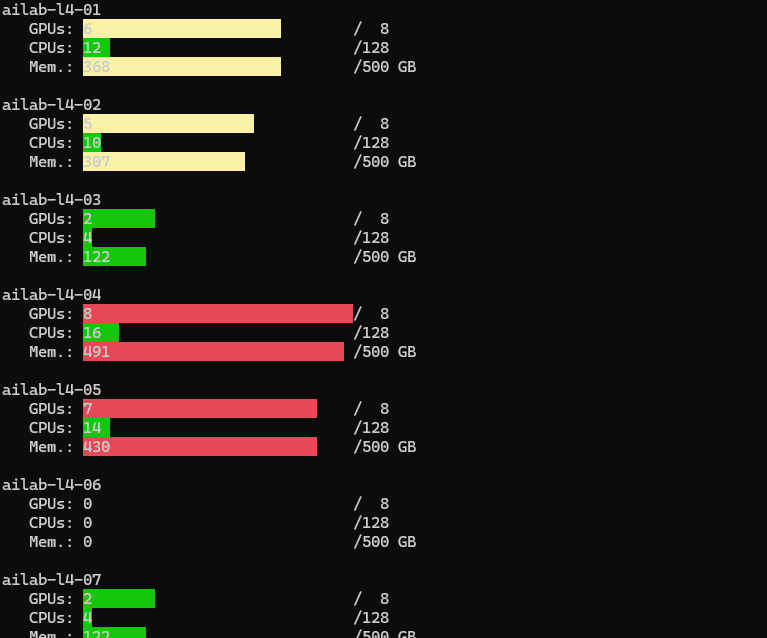
This tool provides:
- Visual overview of all nodes
- Resource utilization (CPU, GPU, memory)
- Easy-to-read status for each node
- Quick assessment of system availability
Monitoring GPU Utilization
Monitoring GPU usage helps you optimize your jobs and ensure you're getting the most out of the allocated resources.
Step 1: Start Your GPU Job
# Start a GPU job (example with PyTorch)
srun --gres=gpu:1 --mem=24G --cpus-per-task=15 --time=01:00:00 \
     singularity exec --nv /ceph/container/pytorch/pytorch_24.09.sif \
     python3 my_training_script.py
Step 2: Find Your Job ID
In another terminal session:
Note your job ID (e.g., 1978).
Step 3: Connect to Your Running Job
Step 4: Monitor GPU Usage
Inside your job's interactive session:
# Use the provided GPU monitoring script
python3 /ceph/course/claaudia/docs/gpu_util.py

# Or use nvidia-smi directly
nvidia-smi
Understanding GPU Metrics
Key metrics to watch:
- GPU-Util: Percentage of GPU being used (aim for 70-100% during training)
- Memory-Usage: How much GPU memory your job is using
- Temperature: GPU temperature (should stay below 80°C)
-
Power: Power consumption (indicates workload intensity)
+-----------------------------------------------------------------------------------------+
| NVIDIA-SMI 555.42.02              Driver Version: 555.42.02      CUDA Version: 12.5     |
|-----------------------------------------+------------------------+----------------------+
| GPU  Name                 Persistence-M | Bus-Id          Disp.A | Volatile Uncorr. ECC |
| Fan  Temp   Perf          Pwr:Usage/Cap |           Memory-Usage | GPU-Util  Compute M. |
|                                         |                        |               MIG M. |
|=========================================+========================+======================|
|   0  NVIDIA L4                      Off |   00000000:01:00.0 Off |                    0 |
| N/A   44C    P0             36W /   72W |     245MiB /  23034MiB |     90%      Default |
|                                         |                        |                  N/A |
+-----------------------------------------+------------------------+----------------------+
|   1  NVIDIA L4                      Off |   00000000:02:00.0 Off |                    0 |
| N/A   38C    P8             16W /   72W |       4MiB /  23034MiB |      0%      Default |
|                                         |                        |                  N/A |
+-----------------------------------------+------------------------+----------------------+
|   2  NVIDIA L4                      Off |   00000000:41:00.0 Off |                    0 |
| N/A   41C    P8             16W /   72W |       1MiB /  23034MiB |      0%      Default |
|                                         |                        |                  N/A |
...

+------------------------------------------------------------------------------+
|  GPU    PID     USER    GPU MEM  %CPU  %MEM      TIME  COMMAND               |
|    0 232843   user@+     236MiB   100   0.1  01:00:20  /usr/bin/python3 tor  |
+------------------------------------------------------------------------------+
The most important parameter to notice here is the
GPU-Utilmetric. Here, you can see that the first GPU is operating at 90% GPU utilization. This indicates excellent utilization of the GPU.You can locate which GPU(s) that belongs to your job, by finding your username below
USERand the GPU number underGPU. In this caseuser@+are utilizing GPU number0in the NVIDIA-SMI list.+------------------------------------------------------------------------------+ | GPU PID USER GPU MEM %CPU %MEM TIME COMMAND | | 0 232843 user@+ 236MiB 100 0.1 01:00:20 /usr/bin/python3 tor | +------------------------------------------------------------------------------+High Utilization (70-100%)
For many GPU-accelerated applications like deep learning training or scientific simulations, a high GPU utilization (often around 70-100%) during compute-intensive tasks is considered good. It indicates that the GPU is efficiently processing tasks without significant idle time.
Low to Moderate Utilization (10-40%)
In some cases, especially when the workload is less intensive or the application is idle waiting for data or other resources, the GPU utilization might be lower (e.g., 10-40%). This doesn't necessarily mean the GPU is underutilized or performing poorly; it could indicate a natural variation in workload or efficient scheduling of tasks.
Congratulations!
You've mastered the fundamentals of AI-LAB! If you experience any errors or have feedback, please let us know!.