Checking the status of compute nodes
It is often desirable to monitor the resource status of the compute nodes when you wish to run a job.
The sinfo command shows basic information about partitions in the queue system and what the states of nodes in these partitions are.
sinfo

PARTITION   AVAIL  TIMELIMIT  NODES  STATE NODELIST
batch*         up   12:00:00      1    mix nv-ai-04
batch*         up   12:00:00      8   idle a256-t4-[01-02],i256-a10-06,i256-a40-[01-02]...
prioritized    up 6-00:00:00      8   idle a256-t4-[01-02],i256-a10-06,i256-a40-[01-02]...
PARTITIONcan be understood as distinct categories or groups of compute nodes, essentially serving as separate queues for jobs.AVAILshows the availability of the partition whereupis normal, working state where you can submit jobs to it.TIMELIMITshows the time limit imposed by each partition inHH:MM:SSformat.NODESshows how many nodes are in the shown state in the specific partition.STATEshows which state the listed nodes are in:mixmeans that the nodes are partially full - some jobs are running on them and they still have available resources;idlemeans that they are completely vacant and have all resources available;allocatedmeans that they are completely occupied. Many other states are possible, most of which mean that something is wrong.NODELISTshows the specific compute nodes that is affected by the job.
You can also use the command scontrol show node or scontrol show node <node name> to show details about all nodes or a specific node, respectively.
scontrol show node a256-t4-01

NodeName=a256-t4-01 Arch=x86_64 CoresPerSocket=16
CPUAlloc=12 CPUTot=64 CPULoad=0.50
AvailableFeatures=(null)
ActiveFeatures=(null)
Gres=gpu:t4:6
...
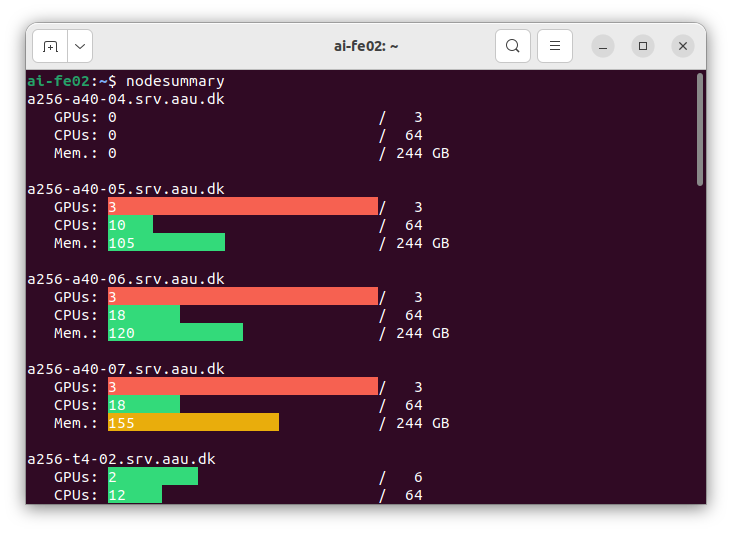
The two commands sinfo and scontrol show node provide information which is either too little or way too much detail in most situations. As an alternative, we provide the tool nodesummary to show a hopefully more intuitive overview of the used/available resources.
nodesummary